
Trading with fractals
A fractal trading strategy is a potent technical analysis technique that helps traders spot market turning points and execute more lucrative trades . This in-depth manual will give a detailed introduction to fractals and describe how to use them in trading techniques throughout a range of time periods. Traders can improve their strategy for catching trend reversals and obtain a deeper understanding of market structure by comprehending fractal
what exacly is a factal trading strategy
A fractal is a recurring pattern, in simple terms, that consistently repeats itself across various scales and contexts. These recurring patterns can be observed in virtually everything—from natural phenomena to financial markets—revealing that few things happen entirely by chance. Advanced analytical methods can be used to identify these fractals, which are especially valuable for forecasting potential future trends. By recognizing these patterns, traders can make more reliable predictions about the timing of events and shifts, ultimately enhancing decision-making and accuracy in trading strategies.
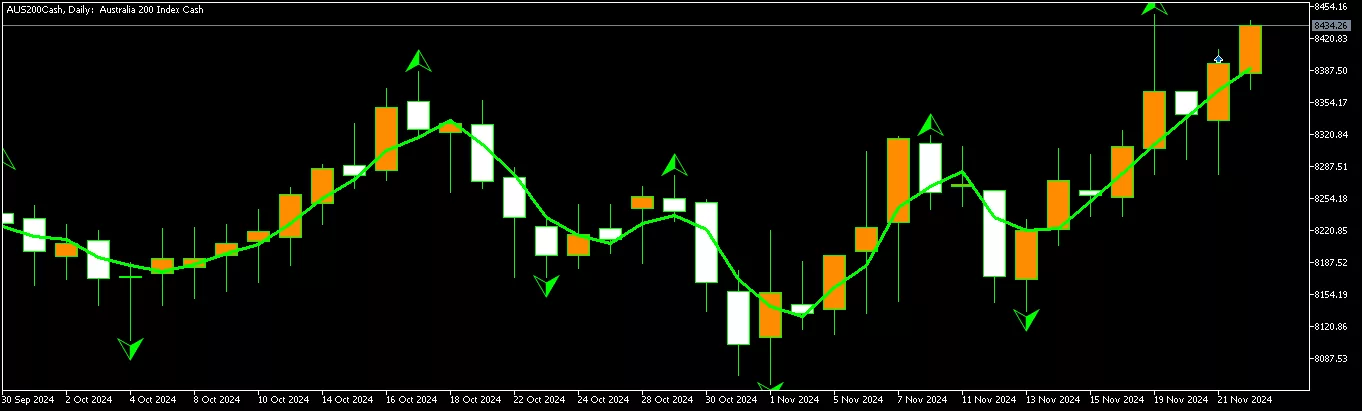
fractal trading strategy used on a chart
- Identify bullish or bearish 5-bar fractal.
- Wait for price to close above/below the fractal high/low.
- Enter breakout on next bar open with stop loss below/above opposite fractal.

trading indicater that helps your forex trading
;
The fractal trading stragety method aims to forecast potential trend reversals by identifying specific patterns in price movement. The most basic fractal pattern consists of five bars or candlesticks with the following characteristics:
1. A transition from a downward to an upward trend is suggested when the lowest bar is located at the center of the pattern, flanked by two bars with successively higher lows on either side.
2. Conversely, a transition from an upward to a downward trend is indicated when the highest bar appears at the center, with two bars featuring successively lower highs on each side. Fractal analysis thus provides traders with insight into potential reversal points within market trends.
rules when using the fractal trading strategy
Traders can determine whether a trend has reversed by using fractal trading. It becomes a potent instrument that can greatly increase trade accuracy and improve decision-making when combined with other technical indicators. Traders can improve their odds of navigating market swings and determining the best times to enter and leave by combining fractal analysis with complimentary tactics.
fractal reversal pater
- he third candle in a series of five would be marked as having the lowest low
- The first two candles in the pattern would have higher lows than the middle candle
- The last two candles in the pattern would have higher lows than the middle candle
so every time a fractal turns up ther is a good chance of a trade reversall
fractal summery
In conclusion, fractals can greatly aid traders in making well-informed choices. a very helpful tool when combined with other indicators, consent is a really complicated and hard to understand for oneself. When used properly, it can greatly raise traders’ success rates.