
Updated August 2026

Brian Rosemorgan
Retired Professional Trader | 8+ Years Experience | South Africa
Questions?
Mastering Market Momentum: How to Identify Strong Forex Moves
Market momentum is one of the most useful concepts a forex trader can understand. It describes the strength and speed behind a price movement and can help traders determine whether a market is showing genuine directional strength or simply moving temporarily.
Strong momentum can appear when buyers or sellers become increasingly aggressive, often causing price to move rapidly in one direction. However, momentum does not mean that price will continue moving forever. A strong move can slow, reverse, or consolidate, which is why momentum should always be combined with sensible risk management and confirmation.
In this lesson, you will learn how to recognise bullish and bearish momentum, identify useful confirmation signals, avoid chasing fast-moving markets, and use momentum as part of a disciplined trading process rather than treating it as a signal to enter every strong-looking move.
1. What Is Market Momentum?
Market momentum refers to the strength behind a price movement. When buyers are consistently pushing price higher, bullish momentum is developing. When sellers dominate and price continues making lower moves, bearish momentum may be present. Momentum is therefore about more than simply whether price is rising or falling; it also concerns the strength and persistence of that movement.
2. How to Recognise Strong Momentum
Strong momentum can often be recognised through consecutive candles moving in the same direction, expanding price ranges, breakouts from established levels, and increasingly clear trends. Traders should avoid relying on a single candle, however. Looking at the surrounding price structure provides a much better picture of whether momentum is genuine.
3. Momentum and Trading Volume
Forex is a decentralised market, so traders do not have one centralised measure of total market volume. Tick volume and activity can still provide useful information, but they should not be treated as proof that a move will continue. Price structure, volatility, support and resistance, and other confirmation tools should also be considered.
4. Avoiding the Trap of Chasing Momentum
One of the biggest mistakes beginners make is entering a trade after price has already moved sharply because they fear missing out. A strong move can attract late buyers or sellers just before a pullback. Instead of chasing price, wait for a sensible entry opportunity, such as a pullback, retest, or other confirmation that fits your trading plan.
5. Combining Momentum With Risk Management
Momentum can identify attractive trading conditions, but it does not remove trading risk. Every momentum trade should have a predefined entry, stop-loss and acceptable risk amount. A trader following the one percent risk principle can participate in strong market movements without allowing one unsuccessful trade to cause serious damage to the account.
💡 Brian’s Expert Advice
During my 8+ years of live trading, I learned that a strong price move can be very tempting, but you should never confuse momentum with certainty. Some of the worst trades happen when a trader sees a large candle and immediately jumps into the market.
My approach is to let the market show its direction first and then look for a controlled opportunity to participate. I would rather miss a trade than enter late simply because I am afraid of missing out. Protecting your capital and following your trading rules must always come before trying to catch every market move.
| Key Feature | What You Need to Know | Actionable Takeaway |
|---|---|---|
| Momentum Direction | Momentum can be bullish or bearish depending on whether buyers or sellers are controlling price. | Identify the dominant direction before considering a trade. |
| Price Confirmation | Strong candles and breakouts can indicate increased market participation, but they do not guarantee continuation. | Look for confirmation from price structure before entering. |
| Risk Control | Momentum trades can move quickly in either direction. | Use a predefined stop-loss and never risk more than your trading plan allows. |
Momentum Trading Checklist
Before considering a momentum trade, ask yourself:
✔ Is there a clear directional move?
✔ Is the overall market structure supporting the direction?
✔ Am I entering because of confirmation rather than fear of missing out?
✔ Do I know where my stop-loss belongs?
✔ Is the potential trade consistent with my risk-management rules?
✔ Am I prepared to walk away if the setup disappears?
If several answers are no, there may be no valid trade. Sometimes the best trading decision is simply to wait.
Frequently Asked Questions
1. What is market momentum in forex trading?
Market momentum describes the strength and persistence of a price movement. Bullish momentum occurs when buyers are driving price higher, while bearish momentum develops when sellers are dominating. Traders use momentum to help identify markets showing directional strength, but momentum alone should not be considered a guaranteed trading signal.
2. How can you identify strong forex momentum?
Strong momentum may be visible through consecutive directional candles, expanding price ranges, breakouts and increasingly clear market structure. Traders should consider several pieces of evidence rather than relying on one large candle. The surrounding support, resistance and trend structure can help determine whether the movement has meaningful confirmation.
3. Is momentum a forex trading strategy?
Momentum can form the foundation of a trading strategy, but it is better viewed as a market condition or trading approach rather than a guarantee of future price direction. A complete strategy should define entries, exits, stop-loss placement, position sizing and risk limits before a trade is opened.
4. Should beginners trade strong momentum moves?
Beginners should be cautious with fast-moving markets because rapid price movements can create poor entries and increased emotional pressure. It is usually better to learn on a demo account first and practise identifying momentum without risking real money. Patience and confirmation are more important than trying to catch every move.
5. What is the danger of chasing momentum?
Chasing momentum means entering after price has already moved substantially because the trader fears missing the opportunity. This can result in buying near a temporary high or selling near a temporary low. Waiting for a pullback, retest or other planned confirmation can help reduce impulsive entries.
6. Can moving averages help identify momentum?
Moving averages can help traders identify the general direction and strength of a trend. For example, a price remaining above a rising moving average may support a bullish trend interpretation. However, moving averages are lagging indicators and should be combined with price action and risk management rather than used in isolation.
7. Does high volume confirm forex momentum?
Forex does not have one centralised exchange reporting total market volume. Tick volume and trading activity can still provide useful context, but they should not be treated as definitive proof of future price movement. Price action, market structure and other confirmation factors remain important when evaluating momentum.
8. How do you manage risk when trading momentum?
Momentum trades should use the same disciplined risk management as any other trade. Decide your maximum acceptable risk before entering, calculate an appropriate position size and establish a stop-loss based on the trading setup. Never increase position size simply because a market appears to be moving strongly.
9. Is momentum trading suitable for South African forex traders?
South African traders can study and practise momentum-based approaches, but the same risks apply as in any other market. Start with a demo account, understand your broker’s conditions and maintain strict risk controls. Traders should also verify the current regulatory status and terms of any broker before depositing money.
🛠 Brokers to Consider for Demo Trading
If you are learning momentum trading, I recommend starting with a demo account rather than rushing into live trading. When comparing brokers, look beyond advertised spreads and consider regulation, commissions, execution, platform availability, withdrawal conditions and customer support.
The brokers below are included because they offer demo-trading options. This section contains affiliate links, so I may receive a commission if you open an account through one of the links. This does not mean that either broker is suitable for every trader. Always research the broker yourself and verify its current regulatory status and trading conditions before opening an account.
XM
✔ Demo account available
✔ MT4 & MT5
✔ Multiple account options
✔ Educational resources
An option to investigate if you want to practise trading on demo while comparing its costs, platforms and account conditions with other brokers.
AvaTrade
✔ Demo account available
✔ MT4 & MT5
✔ AvaTradeGO platform
✔ Educational resources
Another option to investigate if you want to compare platforms, trading conditions and educational resources while practising on demo.
Important: Spreads, commissions, leverage and other trading conditions can change. Always check the broker’s current terms, costs, regulation and withdrawal requirements before opening an account.
📘 Forex Trading for Beginners
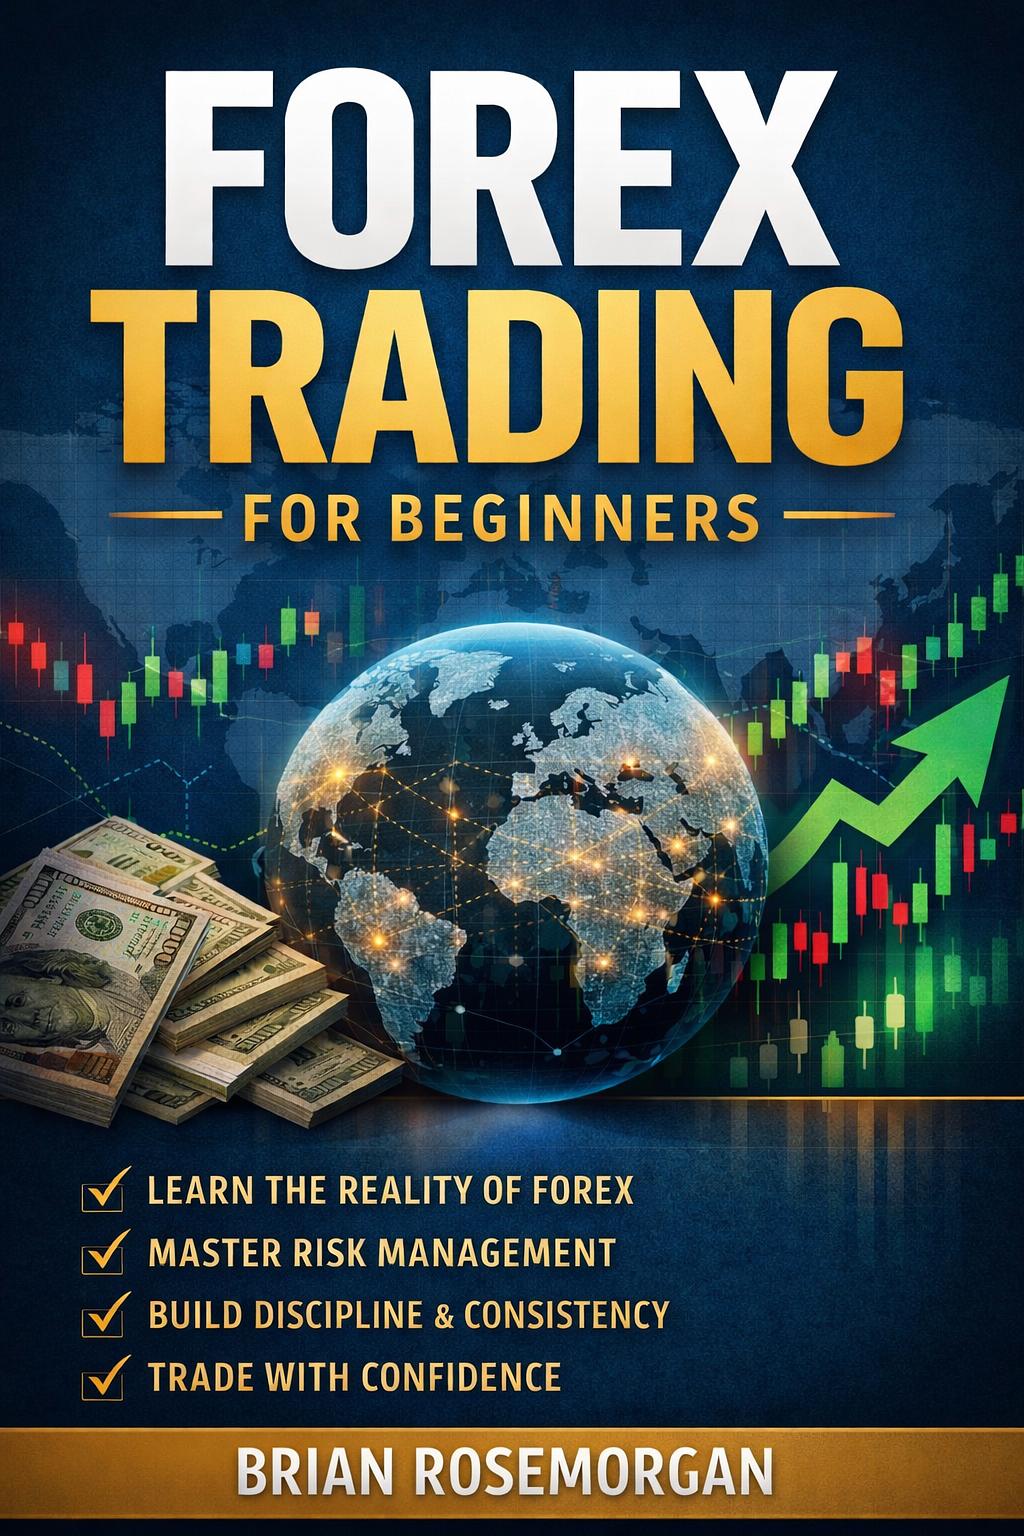
If you’ve enjoyed this free Academy, my book brings everything together in one structured beginner-friendly guide. It’s the perfect companion to the lessons you’ll complete here on TryBuying.
🎉 Lesson Complete
Congratulations! You have completed Mastering Market Momentum.
Click below to record your progress and return to the Academy.
Your progress will be saved automatically. Return to the Academy and continue with your next lesson whenever you’re ready.
Disclaimer: Forex trading and CFDs involve significant risk and may not be suitable for every investor. The information provided on this website is for educational purposes only and should not be considered financial, investment, or trading advice. Always verify that your broker is properly regulated before depositing funds, and practice on a demo account before trading with real money. Never risk money you cannot afford to lose. Past performance does not guarantee future results. Please read our full Risk Disclosure.